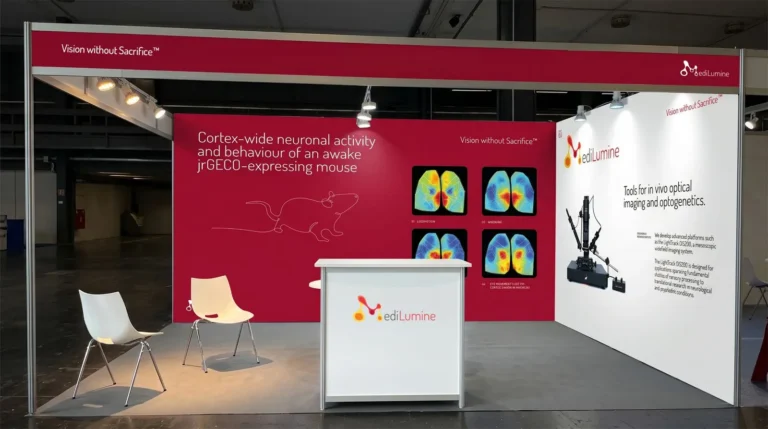
MediLumine at FENS 2026: Visit Us at Booth 159
We’re excited to be exhibiting at FENS 2026 in Barcelona, and we’d love to see you at Booth 159. Stop by to explore our full


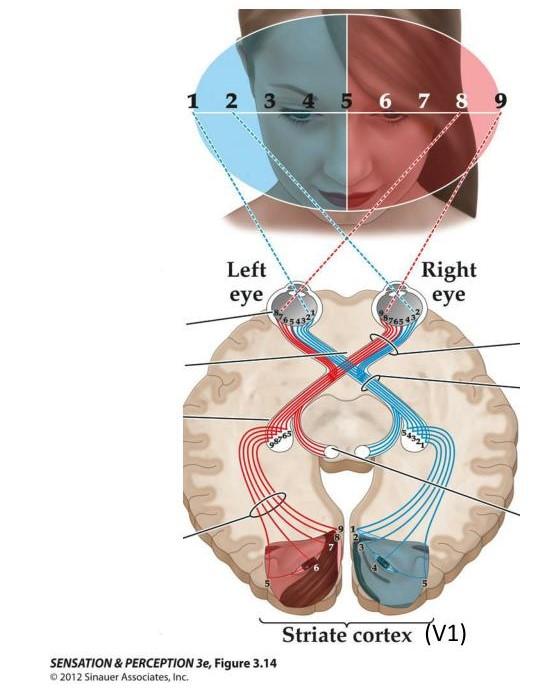
The visual system of mammals is organized so that each section of the visual field is processed by a corresponding region of the brain. This is known as a visuotopic or retinotopic (referring to the retina) organization of the visual system. The retinotopic mapping of the visual cortex has been described in several mammalian species—including primates, carnivores, and rodents—using various anatomical or functional approaches, each with its own advantages and drawbacks.
Generally speaking, anatomical methods for retinotopic mapping (e.g., histological assessment of tracers) provide a detailed visualization of the topographic organization of neurons at the cellular level, with the caveat that this procedure is necessarily post-mortem. This means that the retinotopic organization of the visual cortex of a particular individual is only known after all tests or interventions are completed, which increases the likelihood of errors.
In contrast, functional methods can be used during an experimental session to first obtain the retinotopic map and then use this information to guide other interventions. Among the functional methods available, optical imaging is one of the most widely used in animal research.
Optical imaging has been a key technique in neuroscience research for nearly 40 years. In brief, this method involves illuminating the brain and detecting small fluctuations in light intensity using a highly sensitive camera. These fluctuations can arise from endogenous (intrinsic) signals or exogenous signals, such as calcium indicators and voltage-sensitive dyes, under different illumination wavelengths.
The source of the signal and the wavelength used to illuminate the brain determine the specific aspects of cerebral physiology being observed. These fluctuations can provide valuable insights into various domains of brain function, including neuronal activity, metabolic processes, and vascular dynamics.
These signals are recorded at a mesoscopic scale, allowing imaging of relatively large brain surfaces (several millimeters) simultaneously. This scale provides a significant advantage for studying neurovascular physiology in small animals. Taken together, these features make optical imaging a simple yet versatile technique for assessing brain function in animal research.
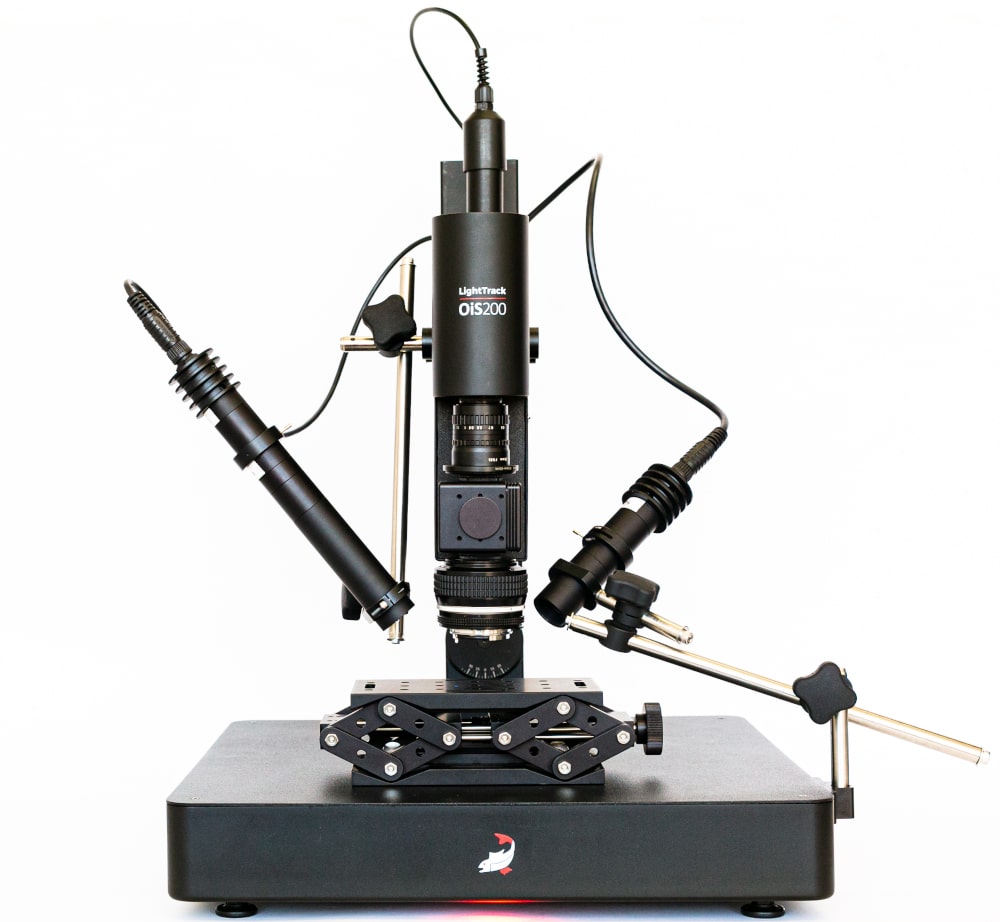
Our OiS200 LightTrack Optical Imaging System is well-suited for this purpose, offering multi-wavelength recordings at a mesoscopic scale. This makes it an ideal option for comprehensive assessments of brain function in various neuroscience research applications.
Optical imaging has been a key technique in neuroscience research for nearly 40 years. In brief, this method involves illuminating the brain and detecting small fluctuations in light intensity using a highly sensitive camera. These fluctuations can arise from endogenous (intrinsic) signals or exogenous signals, such as calcium indicators and voltage-sensitive dyes, under different illumination wavelengths.
The source of the signal and the wavelength used to illuminate the brain determine the specific aspects of cerebral physiology being observed. These fluctuations can provide valuable insights into various domains of brain function, including neuronal activity, metabolic processes, and vascular dynamics.
These signals are recorded at a mesoscopic scale, allowing imaging of relatively large brain surfaces (several millimeters) simultaneously. This scale provides a significant advantage for studying neurovascular physiology in small animals. Taken together, these features make optical imaging a simple yet versatile technique for assessing brain function in animal research.
Our OiS200 LightTrack Optical Imaging System is well-suited for this purpose, offering multi-wavelength recordings at a mesoscopic scale. This makes it an ideal option for comprehensive assessments of brain function in various neuroscience research applications.
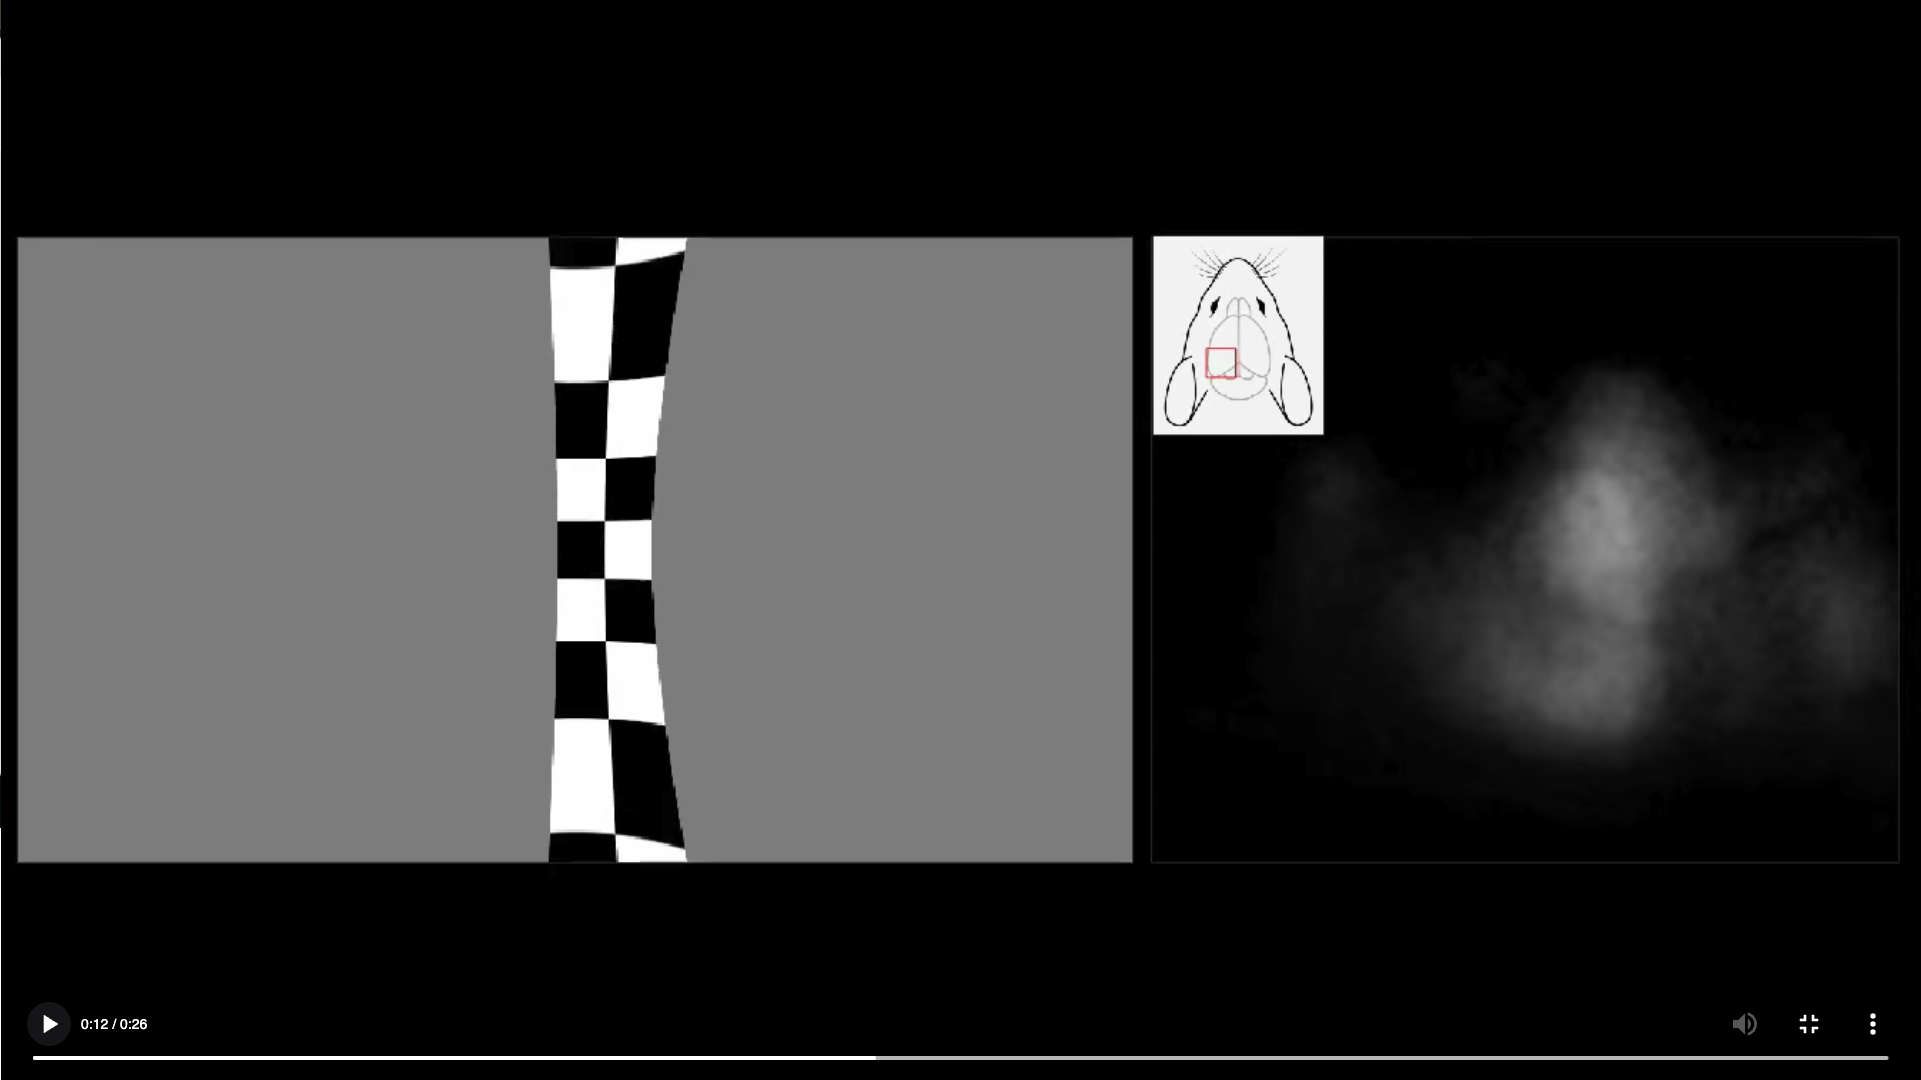
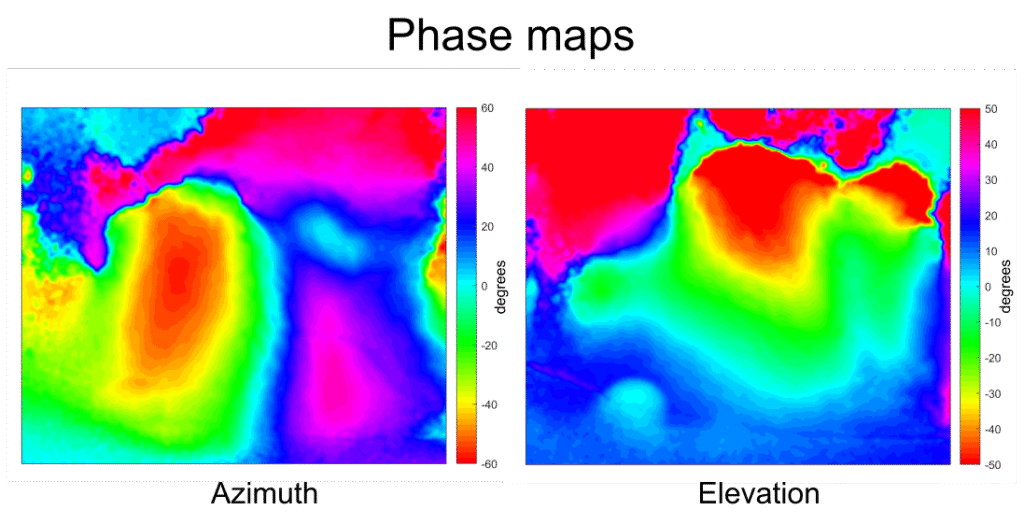
In the context of the visual system, Kalatsky and Stryker (2003) proposed a retinotopic mapping procedure using this approach. A bar drifts periodically across a screen in the animal’s visual field in four cardinal directions. By performing Fourier analysis of the cortical responses, the phase component (phase maps) of the signal at the bar’s temporal frequency for each direction is extracted. These phase maps are then combined to create retinotopic maps for the horizontal (azimuth) and vertical (elevation) axes, where each color corresponds to the position of the bar in the visual field.
The method for retinotopic mapping that is most commonly used today was popularized by Kalatsky and Stryker (2003). In their paper, they described a novel approach to processing optical imaging signals. Traditionally, brain responses were calculated from the presentation of transient (episodic) sensory stimuli, which were then averaged and normalized to a control condition. In contrast, their technique involves presenting a periodic stimulus and performing Fourier analysis of the brain responses at the stimulus frequency. This alternative approach significantly reduces the time required to obtain response maps compared to conventional methods.
Cortical responses to a drifting bar in an awake jrGECO-expressing mouse. The drifting bar was generated using PsychoPy. Data recording was performed using the OiS200 LightTrack Optical Imaging System.
With the large portfolio of transgenic animals available, the mouse has become an invaluable model in neuroscience. Its small brain size and smooth cortex allow the visualization of nearly the entire neocortex at a mesoscopic scale, making optical imaging of the mouse cortex an especially useful technique for investigating brain function and structure.
The analysis of retinotopic maps provides key insights into the functional organization of the visual cortex. For example, studies have examined features such as map size, shape, and phase distribution to investigate the impact of specific proteins on visual processing in mouse knockout models (Souza et al. 2018; Groleau et al. 2014; Greifzu et al. 2016). Other studies have used the technique to characterize the visual capabilities of different mouse strains (Yeritsyan et al. 2012).
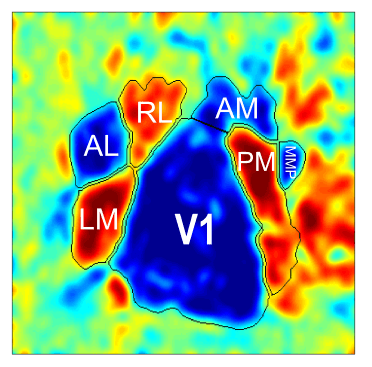
Another important application of retinotopic mapping in mice is the identification of individual visual cortical areas. Recent studies have used retinotopic mapping to identify more than ten visual cortical areas (Garrett et al. 2014; Zhuang et al. 2017). The functional segmentation of individual areas is possible because neighboring visual areas display a mirrored (reversing) pattern of retinotopic gradients. Researchers can use this property to create “visual sign maps,” where regions of reversing gradients mark the borders between visual areas.
The identification of visual areas through retinotopic mapping allows researchers to create individualized maps of the visual cortex for each mouse. These maps can then be used to assess neuronal function using mesoscopic optical imaging or other techniques, such as electrophysiology (Nsiangani et al. 2022) or two-photon microscopy (Marshel et al. 2011), as well as to guide targeted viral or tracer injections (Mocanu and Shmuel 2021).
When combined with other optical imaging techniques such as calcium imaging, retinotopic mapping provides a powerful framework for studying visual function and cortical structure in longitudinal studies with awake mice. Researchers can track how retinotopic maps change over time following trauma, injury, or pharmacological disruption of brain function. This enables the observation of dynamic processes and recovery patterns in a naturalistic setting (e.g., without the confounding effects of anesthesia).
Longitudinal studies also help elucidate the progression of neurodegenerative diseases, the long-term effects of drug treatments, and the influence of genetic modifications on visual processing. Because repeated measurements can be obtained from the same animal, variability is reduced and data reliability is improved.
Optical imaging therefore remains an invaluable tool for investigating complex questions about brain function and plasticity that are difficult to address with other methods. Retinotopic mapping, in particular, continues to provide a detailed and efficient way to study visual cortical organization. As optical imaging technologies and genetic tools evolve, the applications of retinotopic mapping are likely to expand further, offering even deeper insights into the neural basis of vision.
Garrett, M.E., Nauhaus, I., Marshel, J.H., & Callaway, E.M. (2014). Topography and Areal Organization of Mouse Visual Cortex. The Journal of Neuroscience, 34(37), 12587–12600.
Greifzu, F., Parthier, D., Goetze, B., Schlüter, O.M., & Löwel, S. (2016). Ocular Dominance Plasticity after Stroke Was Preserved in PSD-95 Knockout Mice. PLOS ONE, 11(3), e0149771.
Groleau, M., Nguyen, H.N., Vanni, M.P., Huppé-Gourgues, F., Casanova, C., & Vaucher, E. (2014). Impaired Functional Organization in the Visual Cortex of Muscarinic Receptor Knock-out Mice. NeuroImage, 98, 233–242.
Kalatsky, V.A., & Stryker, M.P. (2003). New Paradigm for Optical Imaging. Neuron, 38(4), 529–545.
Marshel, J.H., Garrett, M.E., Nauhaus, I., & Callaway, E.M. (2011). Functional Specialization of Seven Mouse Visual Cortical Areas. Neuron, 72(6), 1040–1054.
Mocanu, V.M., & Shmuel, A. (2021). Optical Imaging-Based Guidance of Viral Microinjections and Insertion of a Laminar Electrophysiology Probe into a Predetermined Barrel in Mouse Area S1BF. Frontiers in Neural Circuits, 15, 541676.
Nsiangani, A., Del Rosario, J., Yeh, A.C., Shin, D., Wells, S., Lev-Ari, T., Williams, B., & Haider, B. (2022). Optimizing Intact Skull Intrinsic Signal Imaging for Subsequent Targeted Electrophysiology across Mouse Visual Cortex. Scientific Reports, 12(1), 2063.
Souza, B.O.F., Abou Rjeili, M., Quintana, C., Beaulieu, J.M., & Casanova, C. (2018). Spatial Frequency Selectivity Is Impaired in Dopamine D2 Receptor Knockout Mice. Frontiers in Integrative Neuroscience, 11.
Yeritsyan, N., Lehmann, K., Puk, O., Graw, J., & Löwel, S. (2012). Visual Capabilities and Cortical Maps in BALB/c Mice. European Journal of Neuroscience, 36(6), 2801–2811.
Zhuang, J., Ng, L., Williams, D., Valley, M., Li, Y., Garrett, M., & Waters, J. (2017). An Extended Retinotopic Map of Mouse Cortex. eLife, 6, e18372.
*This article is licensed under a Creative Commons Attribution 4.0 International License, which permits use, sharing, adaptation, distribution and reproduction in any medium or format
We’re excited to be exhibiting at FENS 2026 in Barcelona, and we’d love to see you at Booth 159. Stop by to explore our full
The Rose Bengal photothrombotic stroke model is widely used in preclinical neuroscience for its simplicity, minimal invasiveness, and precise spatial targeting of ischemia. Despite its