MediLumine at FENS 2026: Visit Us at Booth 159
We’re excited to be exhibiting at FENS 2026 in Barcelona, and we’d love to see you at Booth 159. Stop by to explore our full


Optical imaging has been a valuable tool in neuroscience research for decades. Its wide field of view and high spatial and temporal resolution, this technique has allowed researchers to discover fundamental aspects of brain structure and function at a mesoscopic level. This is especially true for rodents, where their small brain size and smooth cortex allows the simultaneous observation of multiple cortical areas.
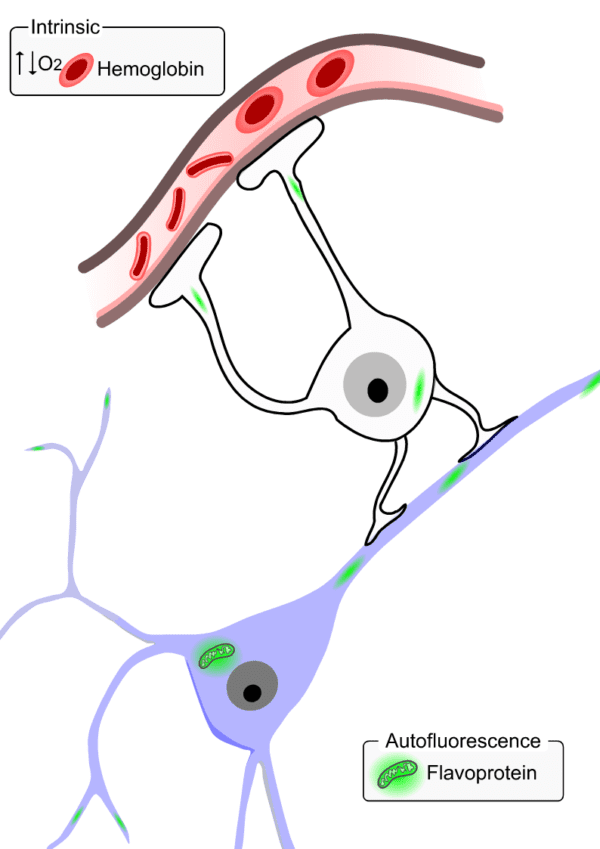
Optical imaging of intrinsic signals has been the method of choice for decades to assess brain function at the mesoscopic scale. In brief, this technique leverages the differences in the absorption spectrum of oxygenated and deoxygenated hemoglobin at different wavelengths to characterize the hemodynamic changes in the local vasculature during brain function. Given the highly localized hemodynamic signals from the capillary bed in brain tissue, intrinsic signals have been extensively used as a proxy for the underlying neuronal activation.
Autofluorescence imaging (AFI) is another, perhaps less commonly known, technique used to measure neuronal activity. It relies on the detection of changes in fluorescence from endogenous mitochondrial proteins inside neurons, named flavoproteins. During aerobic energy metabolism, these flavoproteins are oxidized which is translated by an increase in the molecule’s autofluorescence. Therefore, this signal can be used to measure neuronal activity given that an increase in neuronal responses is directly linked to an increase in its metabolic rate.
Previous studies have suggested that autofluorescence signals in rodents are more robust than larger animals such as cats, making them an ideal model for AFI (Takahashi et al. 2006). Consequently, AFI has been successfully used in various studies to investigate distinct functional modules of the mouse cortex, including the visual (Tohmi et al. 2009), somatosensory (Weber et al. 2004), and auditory (Takahashi et al. 2006) cortices.
In this blog, we explore the mouse primary somatosensory cortex function using both intrinsic and autofluorescence imaging techniques.
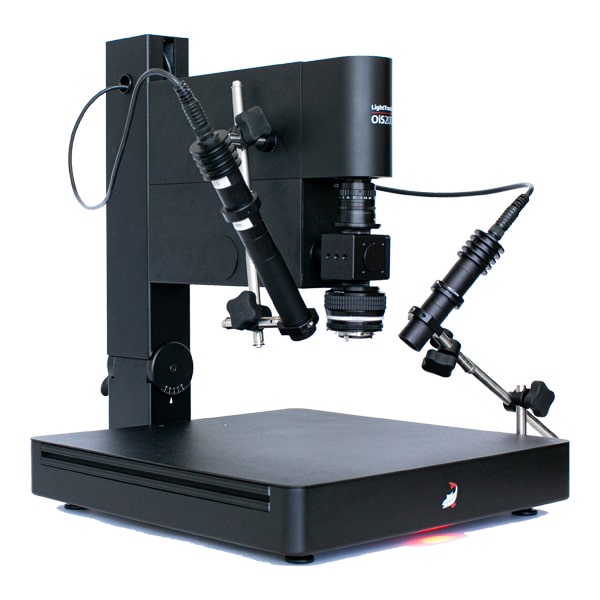
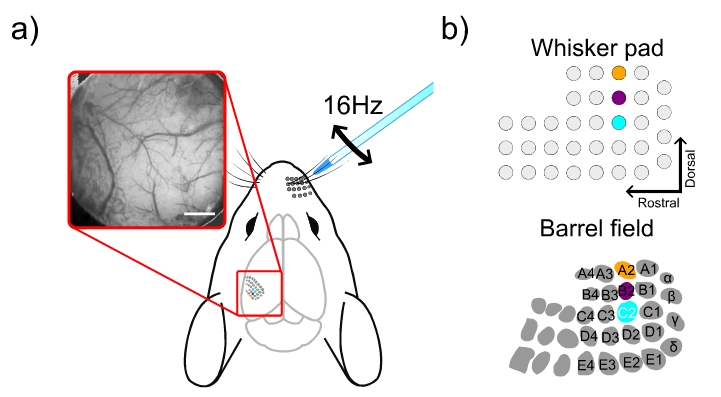
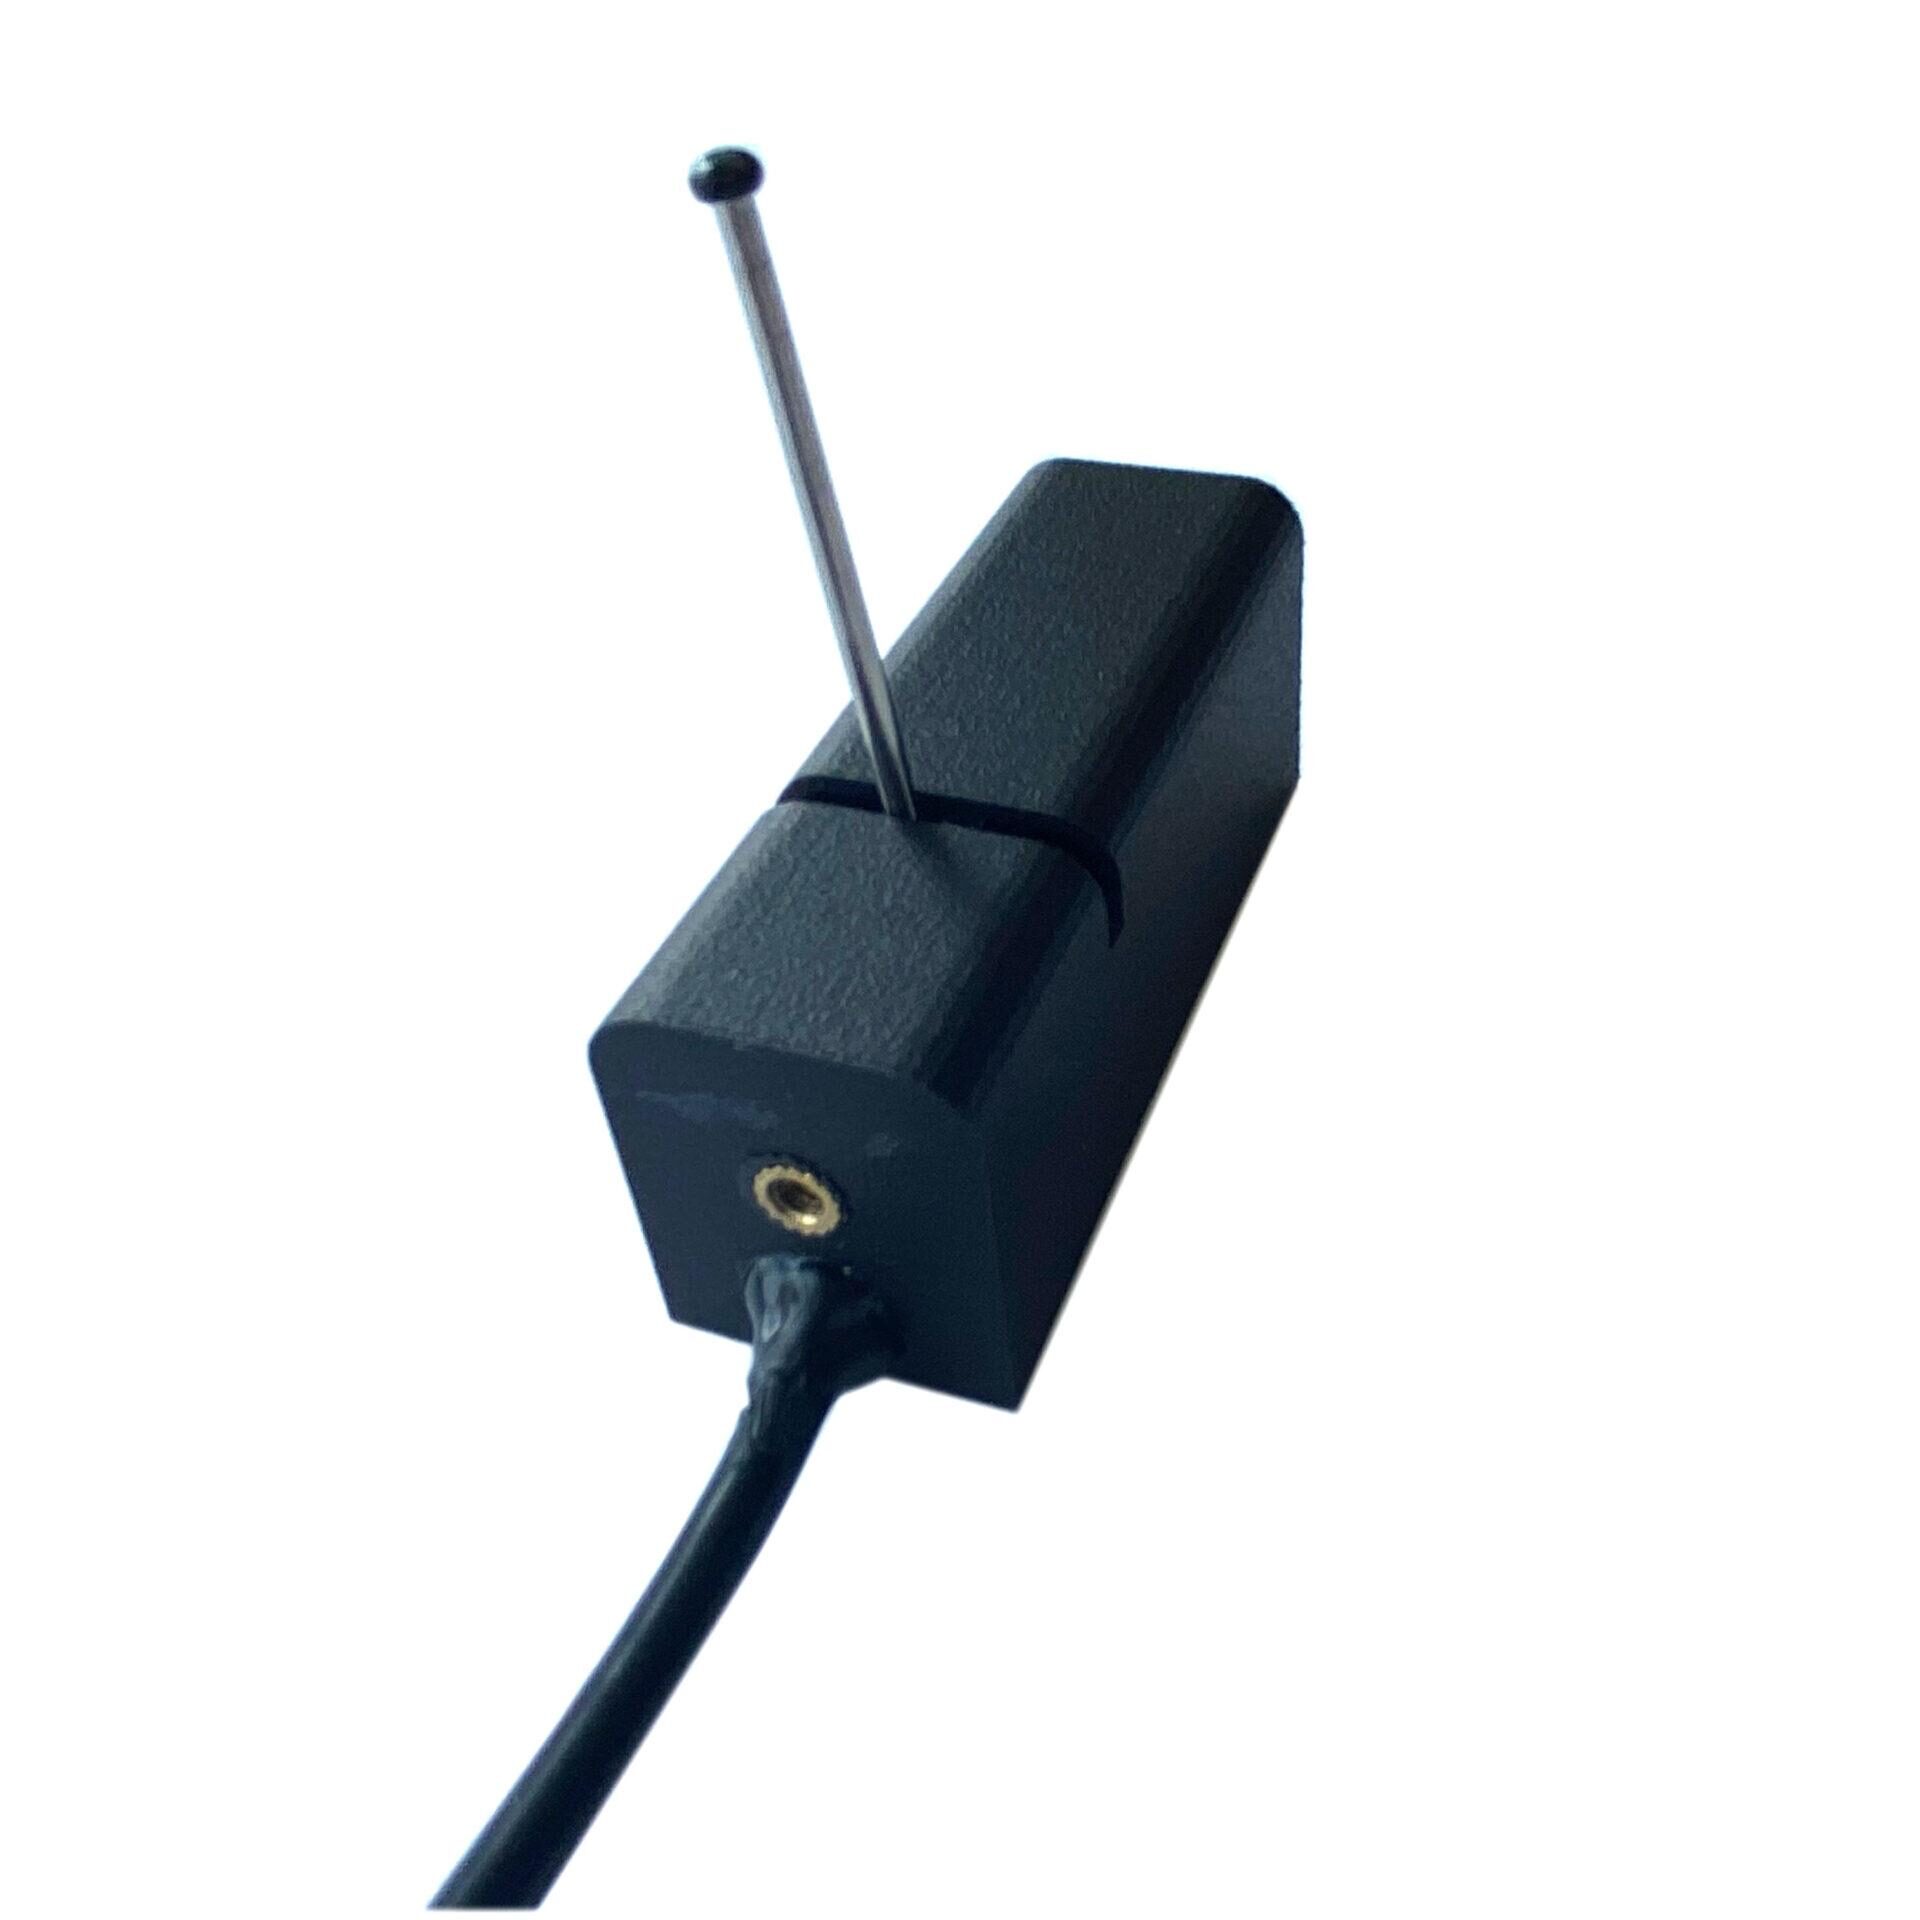
Our experiment was performed on wild-type mice under urethane anesthesia. In brief, cortical responses in the left barrel cortex were recorded following single-whisker stimulation. Whiskers from the right side of the snout were trimmed, leaving only three whiskers from column 2 (A2, B2, and C2) intact. Single whiskers were stimulated using a glass pipette attached to a whisker stimulation device. The stimulation consisted of 16Hz oscillations in the horizontal plane for 4 seconds, with a 14-second inter-stimulus period. Each trial was repeated 20 times. The intrinsic signals were recorded using 525nm (green) and 625nm (red) illumination wavelengths, while autofluorescence signals were detected using 472nm illumination and a 496nm long-pass filter using the OiS200 Light Track imaging system.
A temporal band-pass filter (1/120 to 0.5 Hz) was applied to the red and green channels to remove high-frequency artifacts (e.g. heart, respiration). Each channel (red, green, and fluorescence) was then split by trials and normalized to express the values as DeltaR/R and DeltaF/F. Cortical activation maps were created by subtracting the average pixel values at a 1-second time window around the response peak from the baseline period (average over 2 seconds) and subsequently filtered spatially using a Gaussian filter (Matlab’s imgaussfilt, sigma = 5).
The single-whisker stimulation protocol yielded reliable neuronal activation in the contralateral primary somatosensory cortex. The video below shows an example of the spatiotemporal profile of the neuronal responses in the autofluorescence and intrinsic (red and green channels) signals following the stimulation of the whisker C2.
The signals from the fluorescence and red channels were more spatially localized while the one from the green channel showed a more diffuse activation most strongly in large blood vessels. Thus, we used the red and fluorescence channels to extract the cortical maps of each stimulated whisker at each imaging category (intrinsic and AFI).
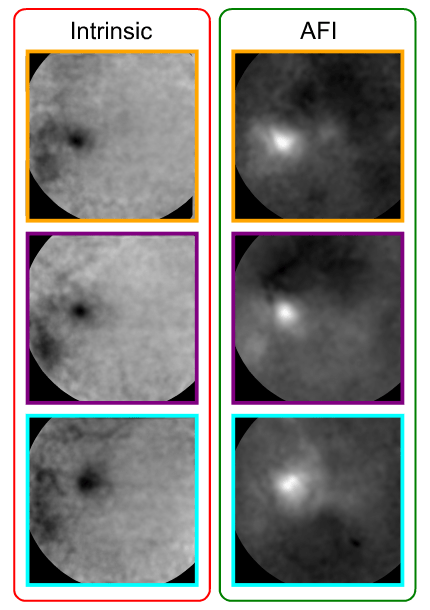
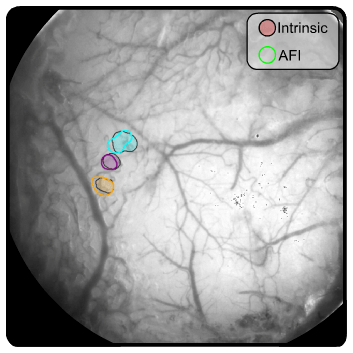
Next, we compared the spatial resolution of both techniques to verify if one provides more spatially localized maps. To do so, we segmented each cortical map by selecting the 10% most responsive pixels. Interestingly, both techniques showed similar results regarding the position and size of the activated regions (see figure below).
Here, we have shown that both intrinsic and autofluorescence imaging can be used to easily map the mouse barrel field. More importantly, this experiment showcases one of many uses of these classical techniques to probe the cortical function of mice.
While significant advancements have been made with exogenous probes such as genetically encoded calcium and voltage indicators in recent years (Mollinedo-Gajate, Song, and Knöpfel 2019), these methods often come with higher complexity and cost. On the other hand, intrinsic and autofluorescence imaging have the benefit to be less invasive and more cost-effective for mesoscopic assessment of neuronal function.
It is worth noting that these techniques are not necessarily mutually exclusive. On the contrary, they are complementary. Endogenous signals are not only used as a proxy measure of the underlying neuronal responses but can also be used in association with exogenous probes such as calcium indicators to provide a more complete picture of brain neurophysiology. While calcium/voltage indicators can provide a more direct measure of the neuron’s activity, autofluorescence and intrinsic signals can inform us about the tissue’s metabolic and hemodynamic/vascular states, respectively. This is exemplified in a recent paper by Wang et al. (2024), where they performed intrinsic, autofluorescence, and calcium imaging in awake and anesthetized mice to assess how these different domains of brain neurophysiology interact at distinct brain states.
Mollinedo-Gajate, Irene, Chenchen Song, and Thomas Knöpfel. 2019. “Genetically Encoded Fluorescent Calcium and Voltage Indicators.” In Concepts and Principles of Pharmacology: 100 Years of the Handbook of Experimental Pharmacology, edited by James E. Barrett, Clive P. Page, and Martin C. Michel, 209–29. Cham: Springer International Publishing. https://doi.org/10.1007/164_2019_299.
Takahashi, Kuniyuki, Ryuichi Hishida, Yamato Kubota, Masaharu Kudoh, Sugata Takahashi, and Katsuei Shibuki. 2006. “Transcranial Fluorescence Imaging of Auditory Cortical Plasticity Regulated by Acoustic Environments in Mice.” European Journal of Neuroscience 23 (5): 1365–76. https://doi.org/10.1111/j.1460-9568.2006.04662.x.
Tohmi, Manavu, Kuniyuki Takahashi, Yamato Kubota, Ryuichi Hishida, and Katsuei Shibuki. 2009. “Transcranial Flavoprotein Fluorescence Imaging of Mouse Cortical Activity and Plasticity.” Journal of Neurochemistry 109 (s1): 3–9. https://doi.org/10.1111/j.1471-4159.2009.05926.x.
Wang, Xiaodan, Jonah A. Padawer-Curry, Annie R. Bice, Byungchan Kim, Zachary P. Rosenthal, Jin-Moo Lee, Manu S. Goyal, Shannon L. Macauley, and Adam Q. Bauer. 2024. “Spatiotemporal Relationships between Neuronal, Metabolic, and Hemodynamic Signals in the Awake and Anesthetized Mouse Brain.” Cell Reports 43 (9): 114723. https://doi.org/10.1016/j.celrep.2024.114723.
Weber, B., C. Burger, M. T. Wyss, G. K. von Schulthess, F. Scheffold, and A. Buck. 2004. “Optical Imaging of the Spatiotemporal Dynamics of Cerebral Blood Flow and Oxidative Metabolism in the Rat Barrel Cortex.” The European Journal of Neuroscience 20 (10): 2664–70. https://doi.org/10.1111/j.1460-9568.2004.03735.x.
Drawings used:
https://doi.org/10.5281/zenodo.3925903
https://doi.org/10.5281/zenodo.3925905
We’re excited to be exhibiting at FENS 2026 in Barcelona, and we’d love to see you at Booth 159. Stop by to explore our full
The Rose Bengal photothrombotic stroke model is widely used in preclinical neuroscience for its simplicity, minimal invasiveness, and precise spatial targeting of ischemia. Despite its