
PRISM in vivo imaging systems now available through Kent Scientific
We are excited to announce that the PRISM In Vivo Imaging System is now available through Kent Scientific — makers of the SomnoFlo low-flow anesthesia


Your bioluminescence data deserves better tools. Here’s what that actually looks like.
Some of our clients using 2D BLI have found their image analysis process looks like this: export raw data, wrestle files into a spreadsheet, colour-code cohorts by hand, attempt to spatially interpret a bright hotspot with no anatomical reference, and repeat across dozens of animals, across weeks or months of timepoints.
You often get stuck in a tedious loops of drawing ROIs, exporting raw radiance or total flux (photons/s/cm²/sr) to Excel, cleaning up headers, and then re-importing into GraphPad Prism to plot longitudinal tumor growth or signal decay.
The science is rigorous. The toolchain around it, historically, has not been.
We’re excited to announce our distribution partnership with In Vivo Analytics and the launch of Freestyle BL : a cloud-native analysis platform purpose-built for 2D BLI data.
One of the most persistent interpretive challenges in 2D BLI is knowing where a signal originates. Is that luminescence peak hepatic? Spinal? Mediastinal? Without anatomical context, a bright spot is just a bright spot — and in oncology, infection, or gene therapy models, the distinction is everything.
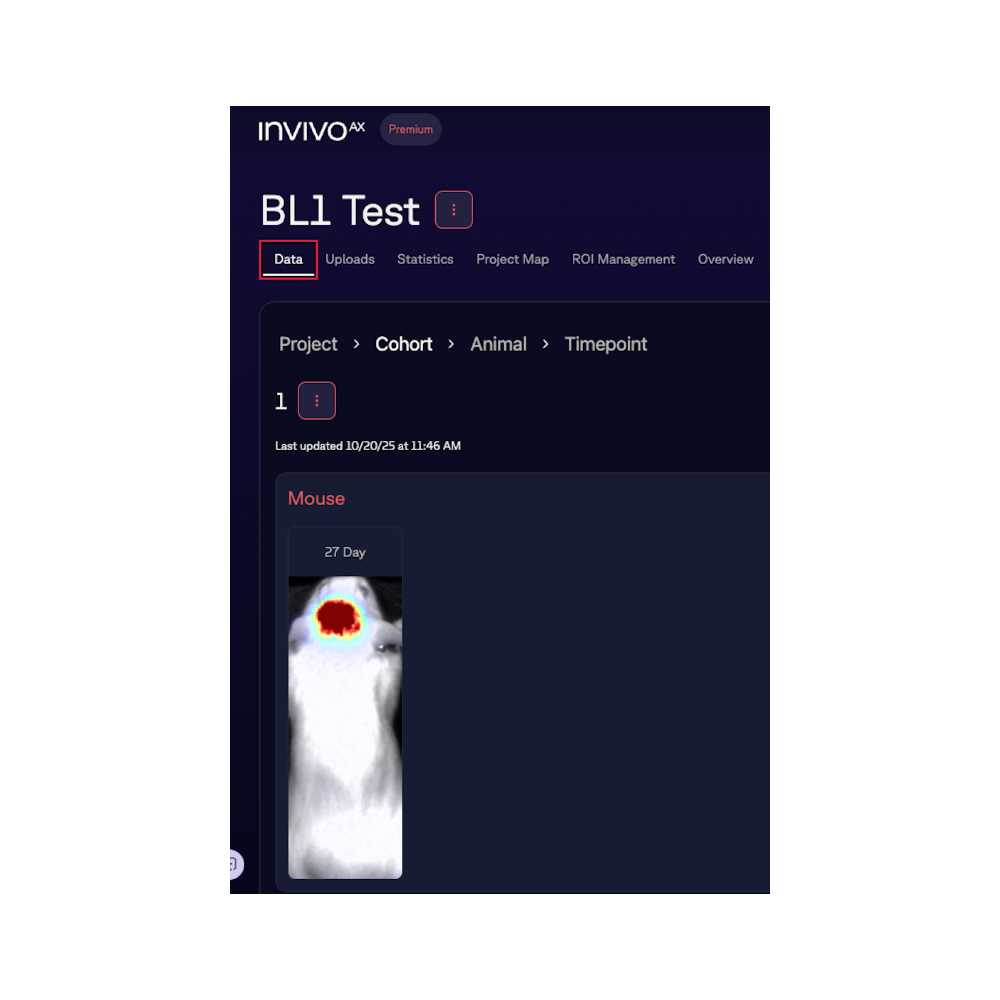
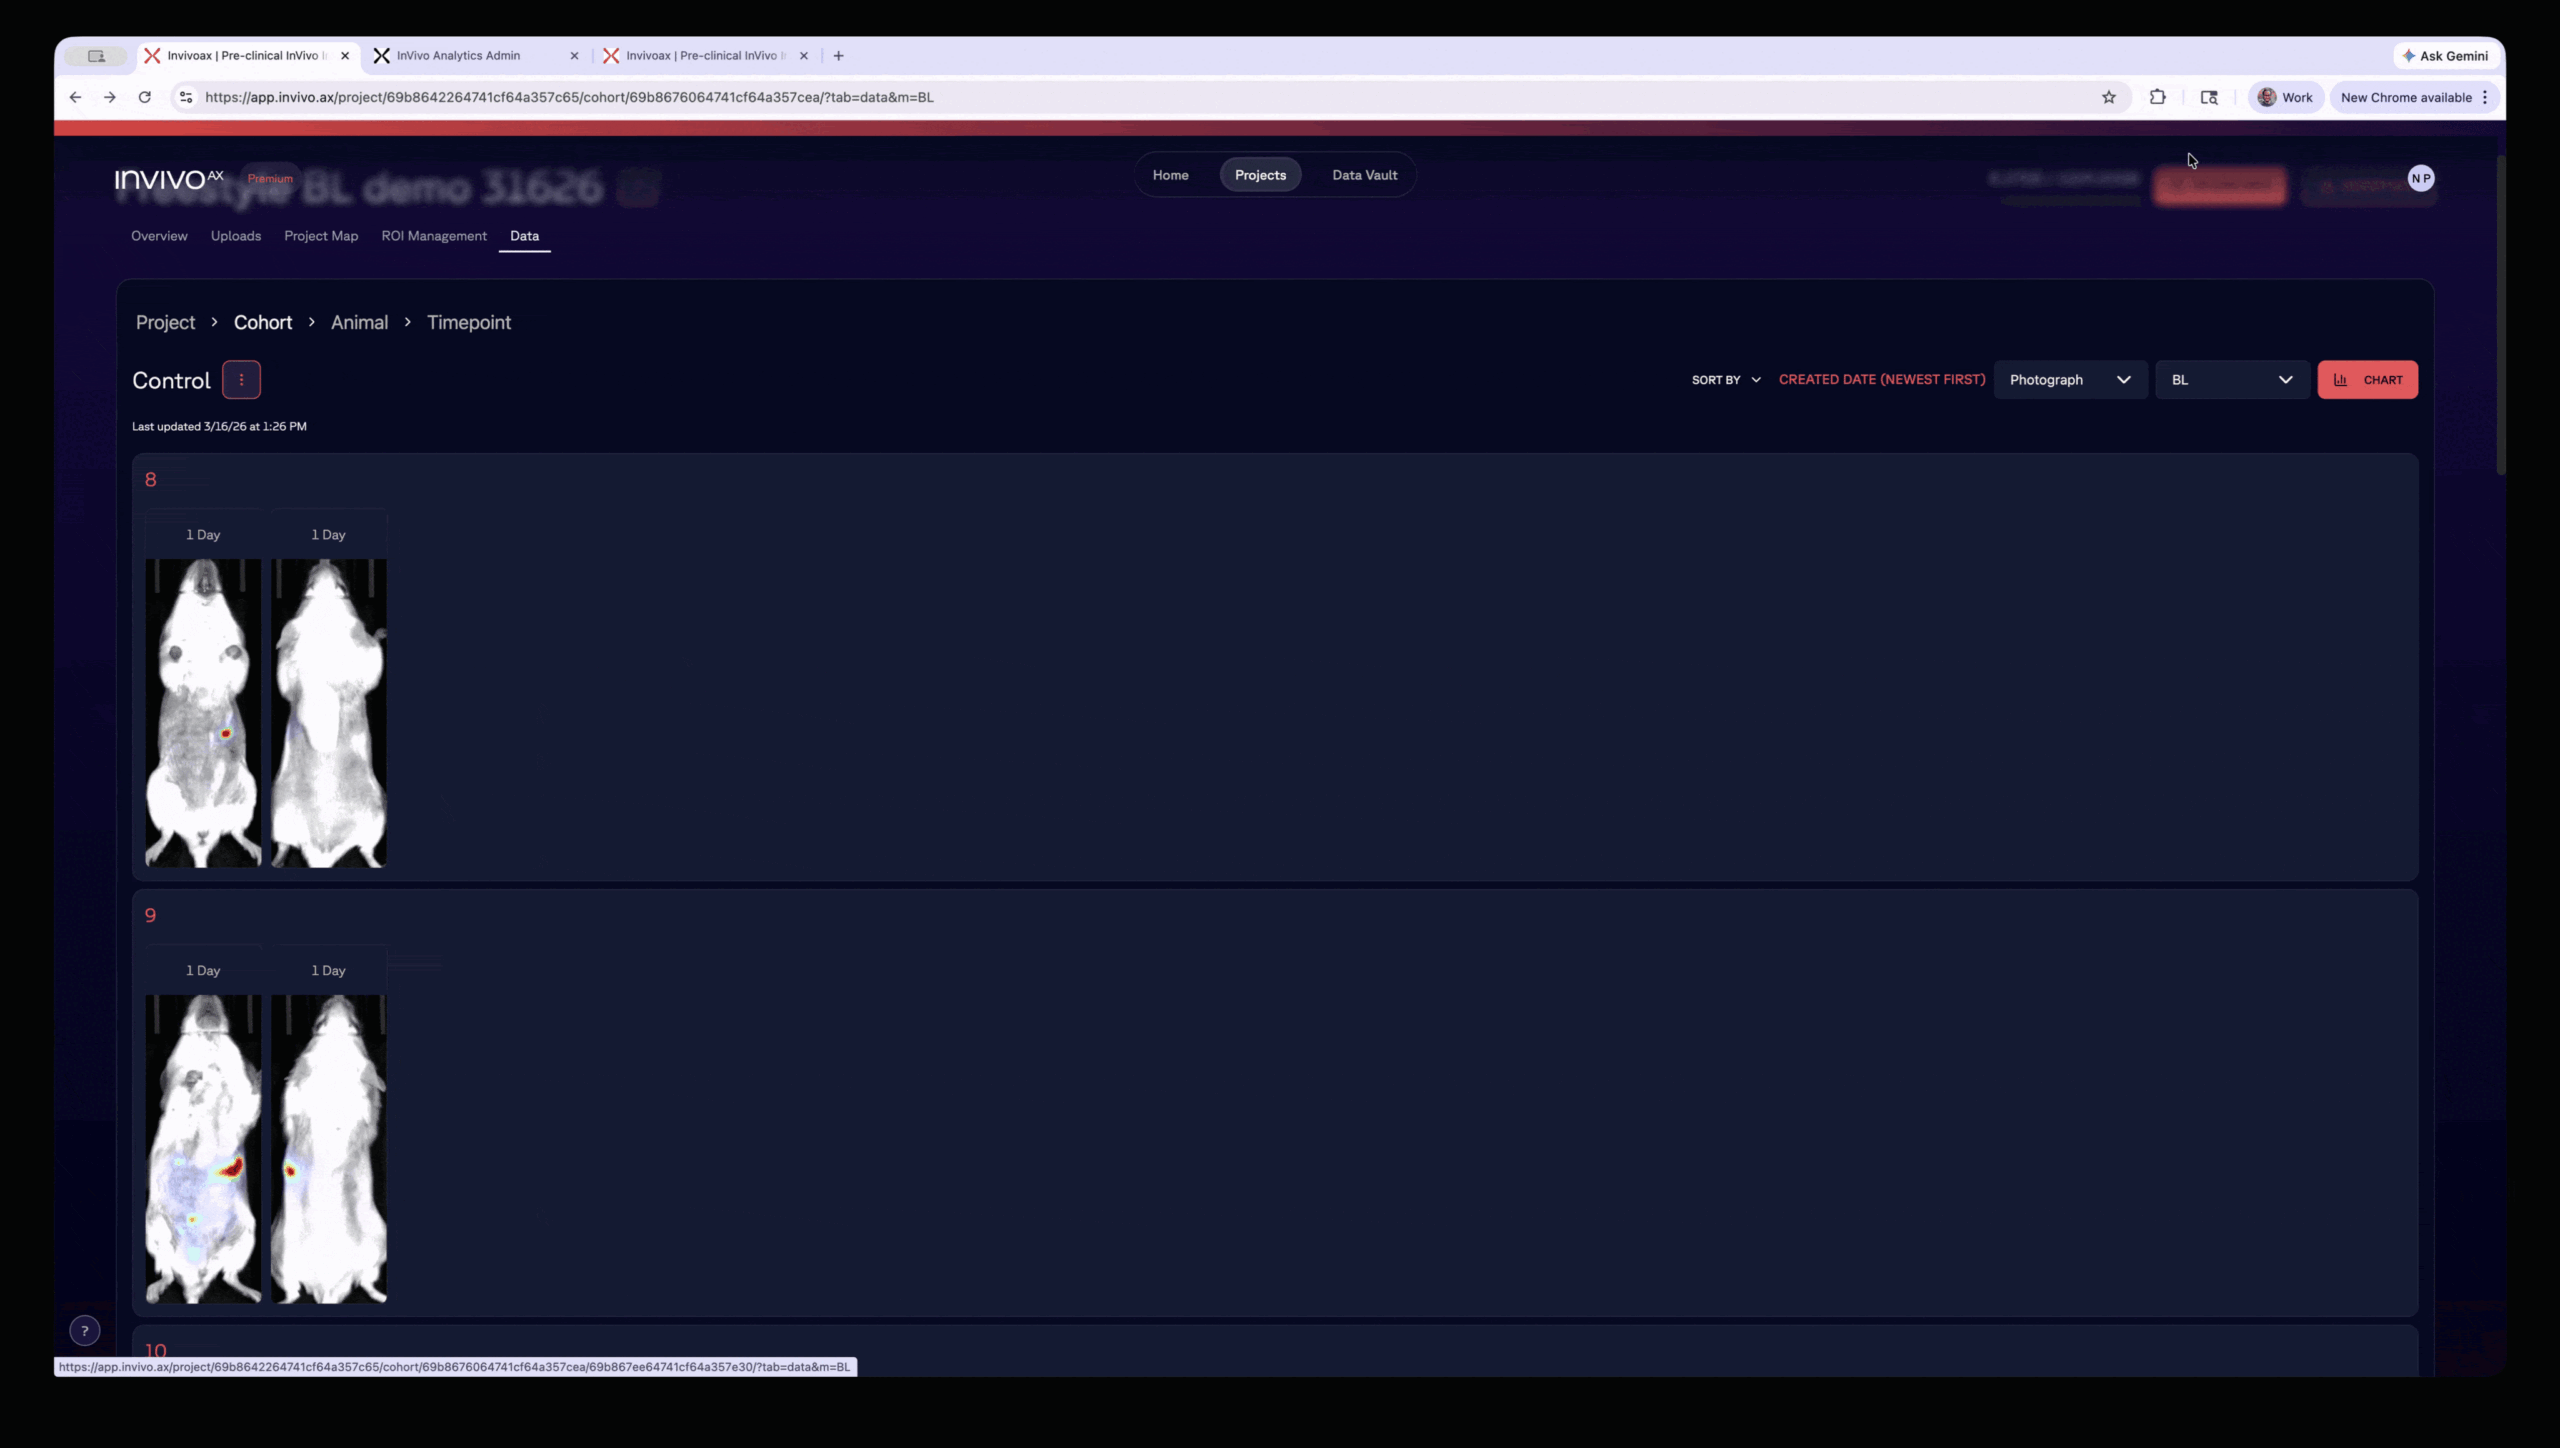
Freestyle BL addresses this directly with an AI model that automatically overlays an anatomically accurate skeleton onto each 2D BLI image. Signal is precisely co-localised to specific body regions — spine, limbs, thorax, cranium — without manual annotation, without Fiji plugins, and without depending on your imaging core’s availability.
Freestyle BL organises your data the way your experiment is structured: projects, cohorts, animal IDs, timepoints. Upload your raw images and the platform preserves that structure automatically in a secure cloud vault — accessible from any device, without shared drives or inconsistent naming conventions.
Built-in longitudinal analysis tools replace the manual wrangling that currently sits between your acquisition system and your figures. Visualise signal intensity over time — per animal, per cohort, or across an entire project — and export publication-ready charts directly. No reformatting. No R scripts. No intermediary steps.
For labs planning a new imaging system acquisition, Freestyle BL pairs with the PRISM Bio-BOX — delivering comparable throughput and image quality to legacy platforms at a significantly lower capital cost. The combined solution can represent savings of over $500,000. If you’re currently in procurement conversations for preclinical BLI equipment, ask us about the Bio-BOX before you sign anything.
Freestyle BL is now available for free trial. Upload your actual 2D BLI images, test the AI skeleton overlay, and explore the full longitudinal analysis suite — with guided onboarding from our team.
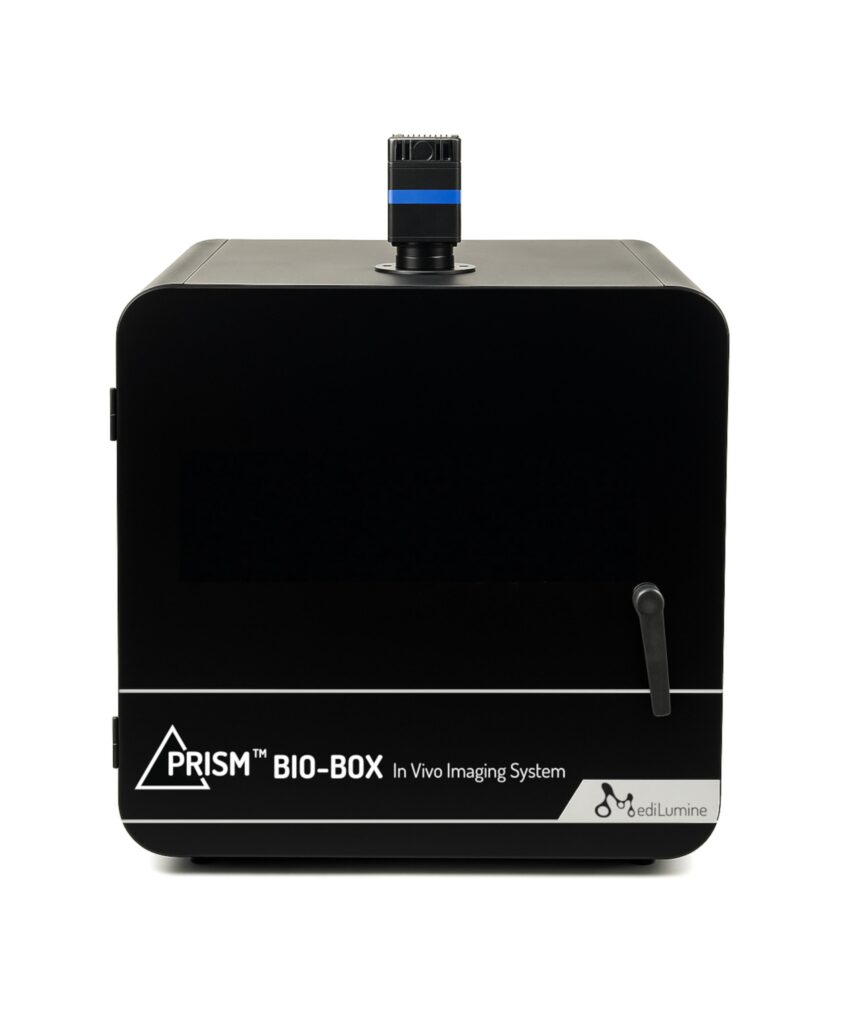
The PRISM™ Bio-BOX by MediLumine is a five-mouse bioluminescence imaging system starting at $75,000 USD, featuring the Sony IMX428LLJ sensor for below-threshold signal detection, low dark noise, and a 20 cm field of view. Paired with Freestyle BL, it delivers a complete imaging and analysis solution at a fraction of the cost of legacy platforms.
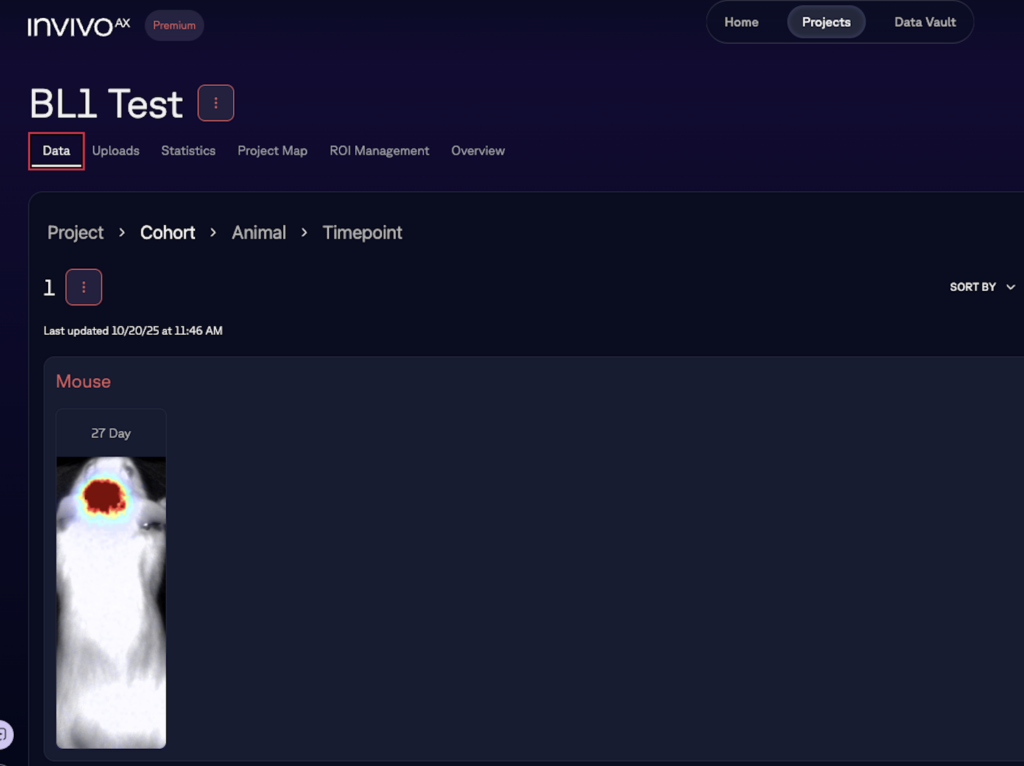
Freestyle BL is a cloud-based analysis platform by In Vivo Analytics that uses AI to automatically overlay an anatomical skeleton onto your 2D BLI images for precise signal localization, replacing manual spreadsheets with built-in longitudinal tracking tools and publication-ready chart exports — all in the browser, no software installation required.
We are excited to announce that the PRISM In Vivo Imaging System is now available through Kent Scientific — makers of the SomnoFlo low-flow anesthesia
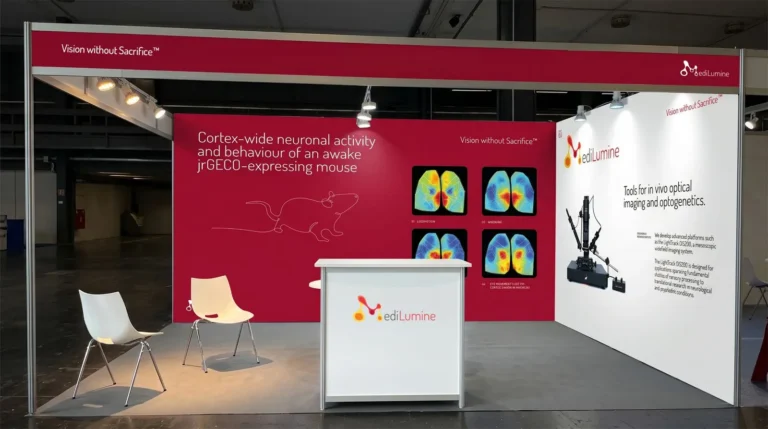
We’re excited to be exhibiting at FENS 2026 in Barcelona, and we’d love to see you at Booth 159. Stop by to explore our full