
New ChatBot for Image Analysis: The Imalytics Virtual Assistant
Image analysis software is an essential tool in preclinical research, but it can be very complex. Even experienced users can find themselves spending valuable time


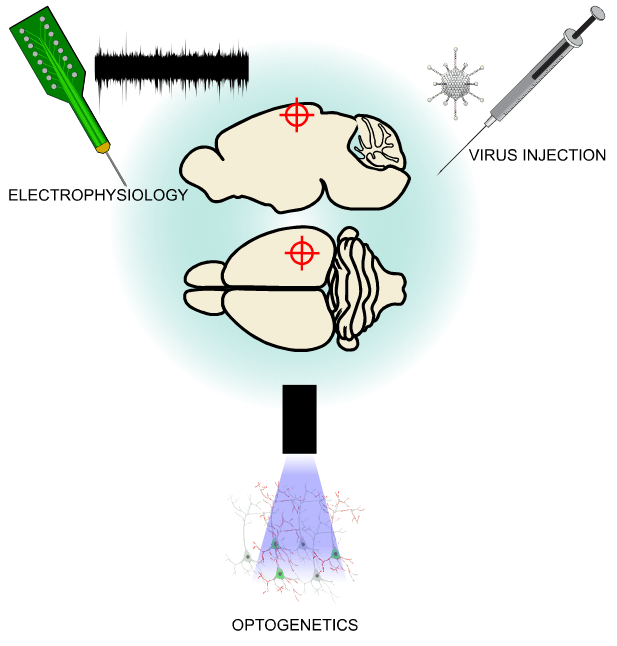
Accurate targeting of cortical regions in rodent models is critical for a variety of neuroscientific applications, including electrophysiological recordings, viral vector delivery, and tracer injections. Traditionally, researchers have relied on stereotaxic coordinates derived from anatomical atlases, followed by histological validation, to confirm targeting accuracy. However, this method can be limited by individual anatomical variability—particularly in mice, where cortical regions of interest can be very small and susceptible to spatial deviation from canonical landmarks such as Bregma.
Functional optical imaging offers a complementary approach that significantly improves targeting accuracy by enabling individualized cortical mapping prior to intervention. In this blog, we present a recent experiment in which we utilized our OiS200 LightTrack optical imaging system to perform functional retinotopic mapping and guide laminar electrode placement in a specific higher-order visual area (RL) of the mouse cortex.
Stereotaxic targeting is essential but imperfect—natural inter-subject variability in brain size, orientation, and morphology can result in suboptimal probe placement. These discrepancies are particularly problematic in small animals like mice, where the margin for error is narrow. When targeting regions involved in sensory processing, misalignment can lead to the collection of irrelevant or inconsistent data.
Recent advances in optical imaging have enabled functional brain mapping with high spatial (~10 µm) and temporal resolution. This technique allows researchers to visualize cortical activation in response to specific stimuli, thus offering an individualized, functionally defined alternative to atlas-based targeting.
Intrinsic signal optical imaging and wide-field calcium imaging are established techniques for delineating cortical areas based on their sensory response properties. Previous studies (e.g., Juavinett et al. 2017; Zhuang et al. 2017) have demonstrated that such mapping can accurately define primary and secondary visual areas, while similar approaches have also been applied to somatosensory (Knutsen et al. 2016) and auditory (Romero et al. 2020) cortices.
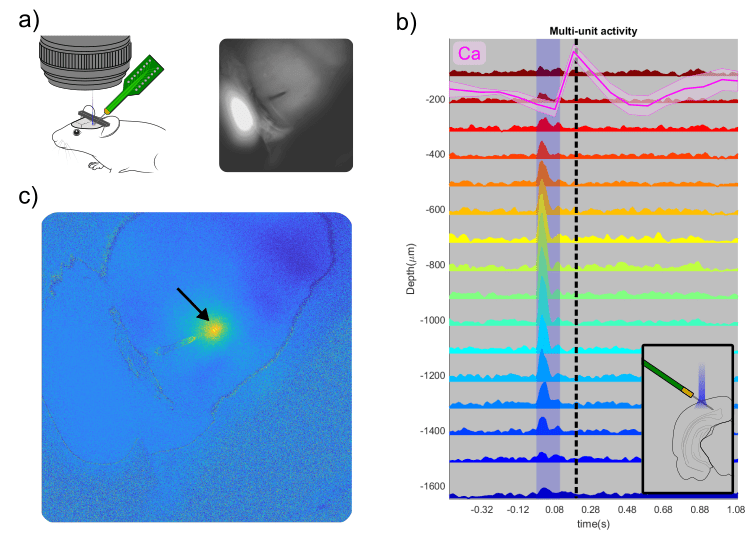
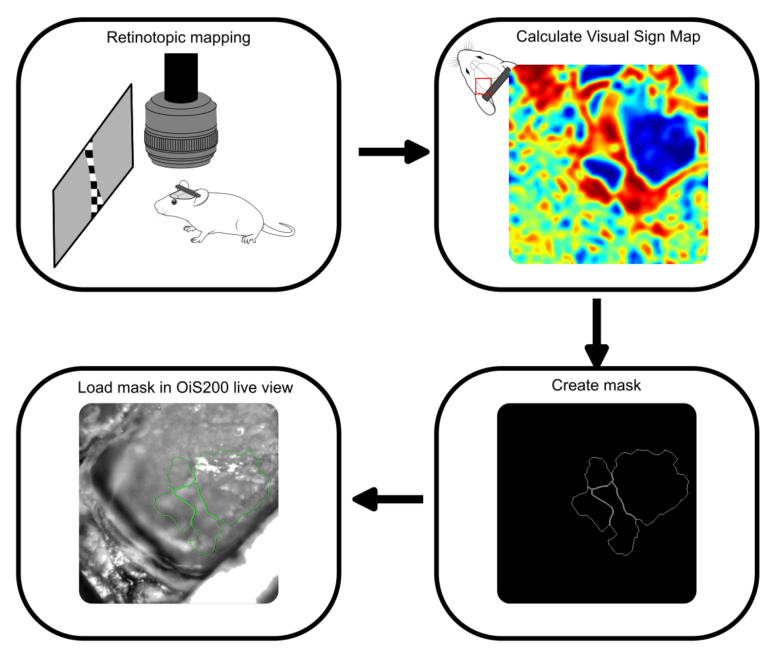
In the current experiment, we performed retinotopic mapping to delineate primary and higher-order visual areas (HVAs) in a mouse expressing the genetically encoded calcium indicator jrGECO and channelrhodopsin in excitatory neurons. Optical imaging was conducted using the OiS200 LightTrack system under 565 nm illumination.
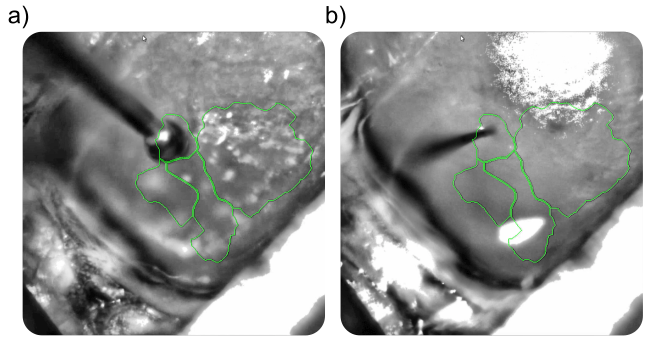
Calcium signals were processed using the umIToolbox. After removal of global oscillations, the data were transformed into the Fourier domain to extract azimuth and elevation phase maps, which were then used to compute the visual sign map. This map served to segment cortical areas and generate a binary mask image to be used for probe guidance.
The binary mask created from the retinotopic map was imported into the OiS200 LightTrack software interface and overlaid in real time on the cortical surface image. This allowed for precise identification of the craniotomy site and accurate insertion of a laminar electrode into the RL area—a higher-order visual region.

Electrophysiological recordings were acquired using OpenEphys, and optogenetic stimulation was delivered via a 450 nm laser using the 2D Illumination Scanning add-on module of the OiS200 system. The responses recorded from the laminar electrode demonstrated robust neuronal activation, temporally aligned with optogenetic stimulation, and were corroborated by localized calcium transients in the same region.
The visual sign map clearly demarcated V1 and at least three HVAs: RL, AL, and LM. Guided by this map, the RL region was selected for electrophysiological recordings. Optogenetic stimulation yielded consistent increases in multi-unit activity across multiple electrode channels, with a temporal profile matching the recorded calcium signal.
This integrative approach—combining functional optical imaging with electrophysiology and optogenetics—demonstrates the value of individualized functional maps for precise cortical targeting. The overlay feature of the OiS200 LightTrack simplifies this workflow by enabling live alignment of functional maps with the cortical surface, reducing spatial uncertainty and increasing the reproducibility of experimental procedures.
By integrating functional imaging into the experimental pipeline, researchers can mitigate the limitations of atlas-based targeting and improve the precision of cortical interventions. The OiS200 LightTrack system facilitates this process through high-resolution imaging, intuitive interface, and real-time guidance capabilities. This approach is particularly valuable in studies requiring high spatial fidelity, such as circuit mapping, targeted viral delivery, and laminar recordings.
Image analysis software is an essential tool in preclinical research, but it can be very complex. Even experienced users can find themselves spending valuable time
Accurate targeting of cortical regions in rodent models is critical for a variety of neuroscientific applications, including electrophysiological recordings, viral vector delivery, and tracer injections.