Widefield Imaging Data Analysis with DataViewer: From Raw Recording to ROI Signals
DataViewer software for widefield imaging data analysis
Widefield (mesoscopic) optical imaging lets researchers record activity across large areas of the mouse cortex at once. Signals can come from the tissue’s intrinsic optics or from genetically encoded calcium indicators (GECIs), and a single system can capture calcium, intrinsic and laser speckle signals separately or together.
Turning those recordings into results takes many steps: importing raw camera files, inspecting image time series, filtering and normalizing (ΔF/F or ΔR/R), correcting for hemodynamics, aligning sessions, defining regions of interest (ROIs) and extracting time courses for group analysis.
Most open-source imaging packages target fMRI or two-photon microscopy. Tools for mesoscopic data are scarcer, and many circulate as scripts that are hard to document, share and reproduce. LabeoTech developed the Universal mesoscopic Imaging Toolbox (umIT) to close that gap. This article walks through its main application, DataViewer, using a real calcium imaging experiment.
What Is DataViewer?
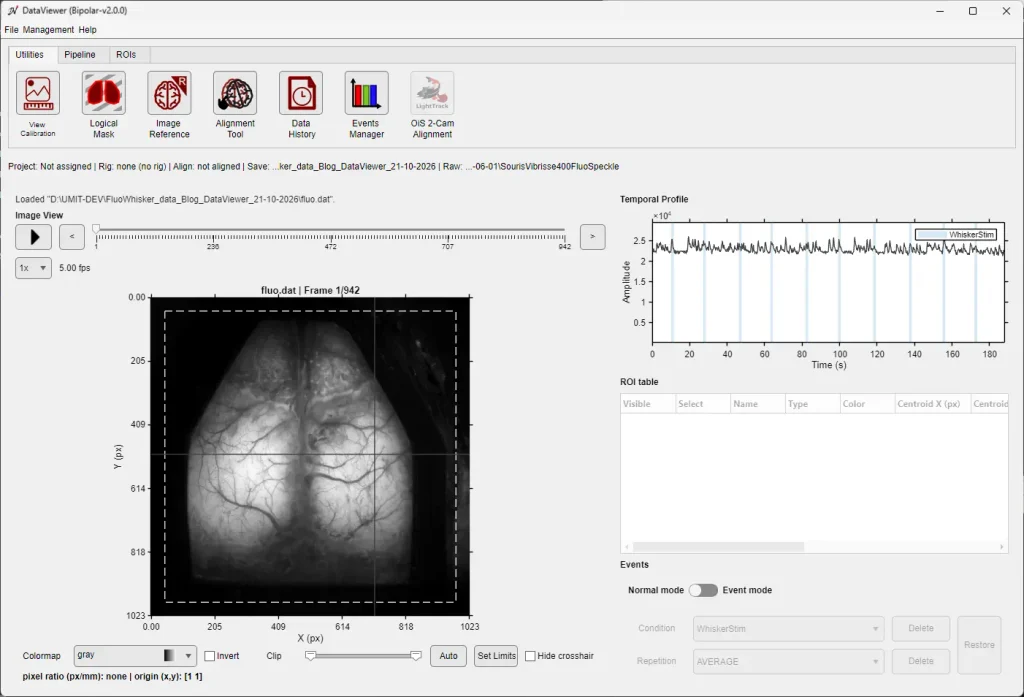
DataViewer is the graphical application at the core of the umIT toolbox. In a single window, you can import recordings, view image time series and temporal signals, run processing pipelines, and create and measure ROIs.
Key features:
Supports both resting-state recordings and event-triggered averages
Keeps project metadata organized alongside the data
Built-in pipeline of common processing algorithms, extendable with your own functions (DataViewer documentation)
Designed for low- to medium-throughput experiments, processed individually or in batches
DataViewer, the main application of umIT Bipolar v2.0.0″ — alt text: “DataViewer interface showing widefield imaging time series
Example: Widefield Calcium Imaging from Raw Recording to ROI Signals
The example below follows a whisker-stimulation calcium imaging experiment, processed with umIT Bipolar v2.0.0.
The Recording
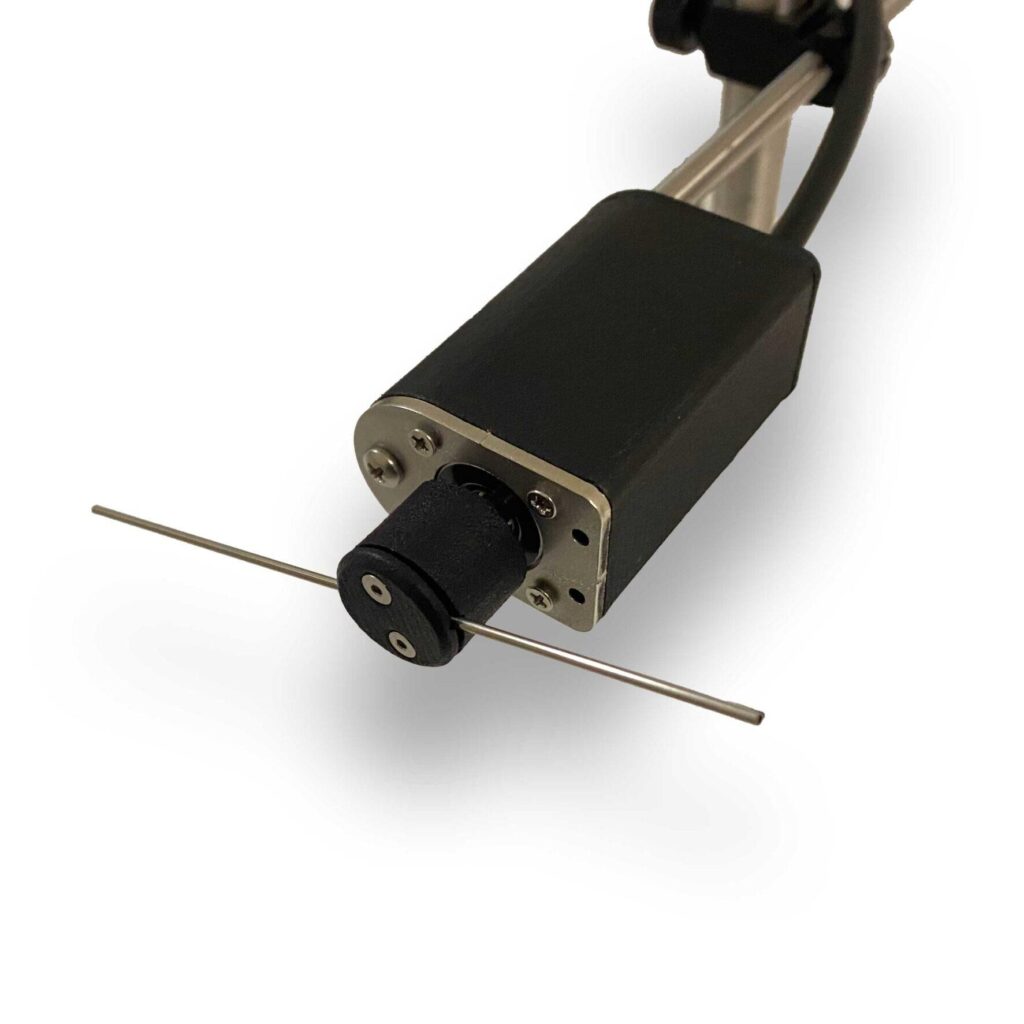
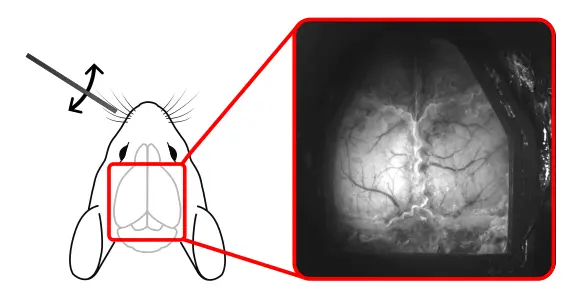
A head-fixed mouse expressing the calcium indicator GCaMP6s in cortical neurons was imaged through a thinned skull over the dorsal cortex. The left whisker pad was stimulated 10 times, for about 1.5 s each, using a mechanical whisker stimulator.
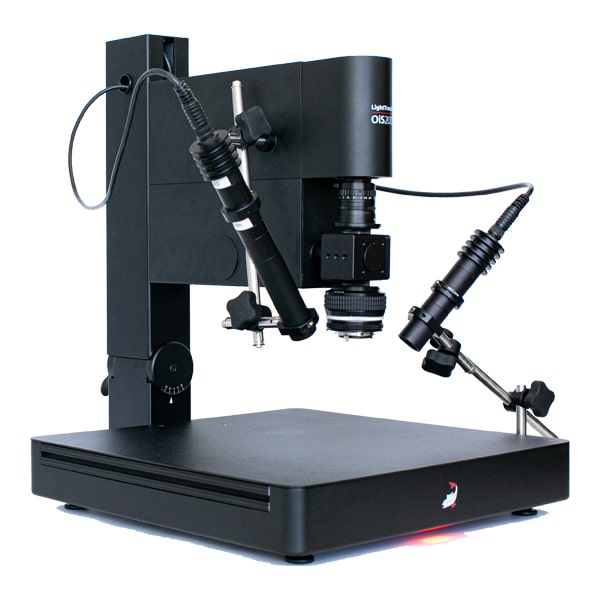
Data were acquired with the LightTrack OiS200 modular optical imaging system. Calcium, intrinsic and speckle signals were recorded simultaneously with interleaved multi-color illumination at 5 Hz per channel. Only the fluorescence (calcium) channel is analyzed here.
Experimental setup. The left whisker pad of a head-fixed mouse expressing GCaMP6s was stimulated while the dorsal cortex was imaged through a thinned skull (right).
Processing Widefield Imaging Data Step by Step
Step 1: Import the Raw Recording
DataViewer imports the raw recording directly and creates one data file per imaging channel. Each file stores the information needed to read it, such as image size and frame rate.
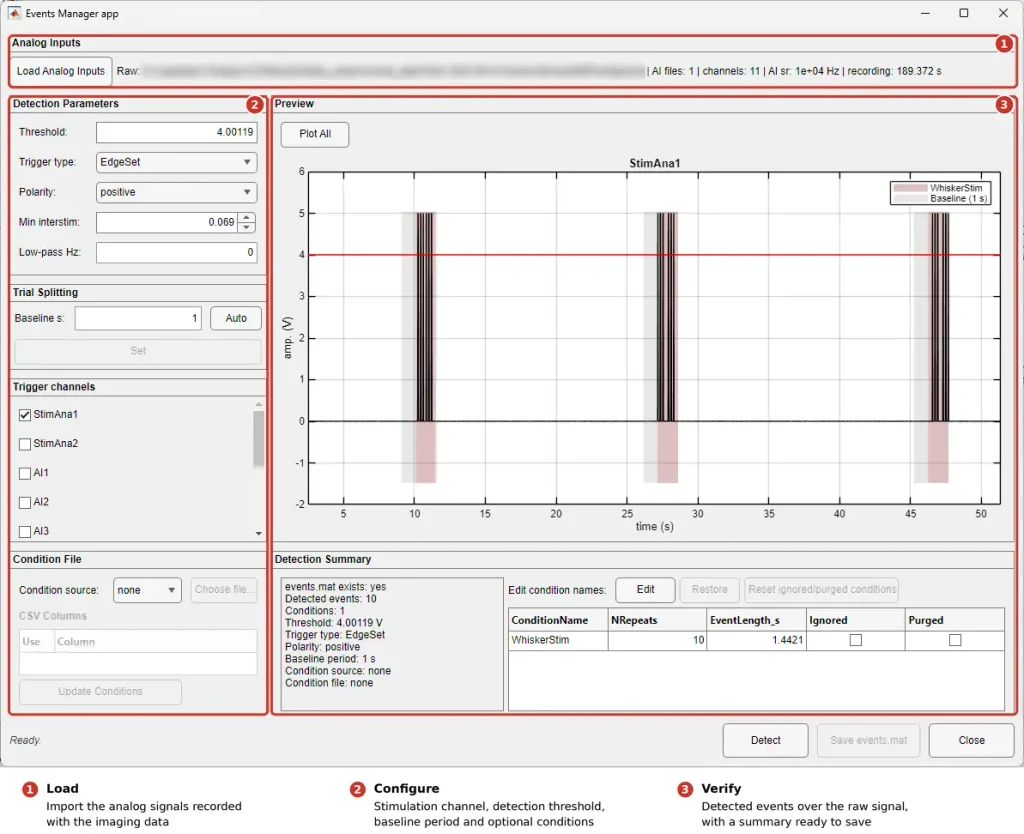
Step 2: Detect the Stimulation Events
To build event-aligned averages, DataViewer first finds each stimulus onset. In the Events Manager:
Load the analog signals recorded with the imaging data.
Choose the stimulation channel and the detection settings.
Check the detected events against the raw signal, then save them.
In this example, DataViewer detects all 10 trials.
Detecting stimulation events with the Events Manager. (1) Load the analog signals recorded with the imaging data. (2) Choose the stimulation channel and the detection settings. (3) Check the 10 detected events on the raw signal before saving them.
Step 3: Explore the Raw Signals
Click any pixel to display its time course and confirm that signal levels are adequate across the cortex. Play the recording at different speeds to spot artifacts such as movement.
Next, draw a logical mask to exclude areas outside the cranial window or over large blood vessels. Masked pixels are left out of all later processing and ROI creation.
Exploring the raw fluorescence signal. Clicking on pixels displays their time course; a logical mask is then drawn to exclude regions outside the cortex from further analysis.
Step 4: Build the Processing Pipeline
In the Pipeline Manager, the analysis runs in three steps:
Split the data into trials around each stimulus.
Normalize to baseline (ΔF/F).
Apply a spatial Gaussian filter to reduce pixel noise.
The result is an event-aligned ΔF/F dataset that can be viewed trial by trial. The average response map shows activation in the right barrel cortex, contralateral to the stimulated whiskers.
Building and running the analysis pipeline in the Pipeline Manager: splitting the data into trials, normalizing to baseline (ΔF/F) and spatial filtering. The resulting average response map shows the activated region in the right barrel cortex.
Step 5: Create an ROI and Export Its Signal
Apply a threshold to the response map at its peak to define an ROI over the responsive region of the barrel cortex. You can then save the ROI or export its average time course as a CSV file for statistics or plotting in other software.
Creating an ROI by thresholding the response map at its peak, then saving the ROI or exporting its time course to a CSV file.
Consistent, documented processing makes widefield imaging results easier to compare across animals, sessions and labs. umIT Bipolar v2.0.0 brings data import, exploration, processing and ROI analysis together in one window, so every step can be traced and repeated.
What is widefield (mesoscopic) imaging? An optical imaging approach that records activity across large areas of the cortex at once, using intrinsic signals or fluorescent reporters such as calcium indicators.
What is DataViewer? The main graphical application of LabeoTech’s umIT toolbox. It imports recordings, displays image time series, runs processing pipelines and measures ROIs in one window.
What kinds of experiments does DataViewer support? Resting-state recordings and event-triggered designs, such as sensory stimulation, in low- to medium-throughput studies.
Can I export ROI signals for further analysis? Yes. The average time course of an ROI can be exported as a CSV file.
de Souza BOF, Samantzis M, Albert C, Belanger S, Bouchard JF, Balbi M, Vanni MP. Bridging the Gap: umIT Makes Complex Imaging Data Accessible to Scientists of All Backgrounds. Neurophotonics. 2025;12(S1):S14616. doi:10.1117/1.NPh.12.S1.S14616
Get Started with Widefield Imaging
Planning a widefield or calcium imaging study? Contact MediLumine to discuss imaging systems and stimulation tools for your lab.
Widefield (mesoscopic) optical imaging lets researchers record activity across large areas of the mouse cortex at once. Signals can come from the tissue’s intrinsic optics